
A burgeoning demand the Internet of Things is propelling exponential growth in the trade of electronic components - to the benefit of developing countries, new figures show.
Demand for electronic components used in Internet-of-Things (IoT) devices drove the value of trade in international imports of information and communications technology (ICT) goods in 2017 to reach $2.1 trillion, according to new figures released by UNCTAD.
Trade in ICT goods grew slightly faster than merchandise trade and represented 13.4% of the total in 2017, down from the 16.1% high during the dot-com boom in 2000 but the highest in two years. By comparison, in 2017 machinery and transport equipment accounted for 37% and food for 8% of merchandise imports.
“This is the first time that global ICT goods imports have rebounded since 2014, showing a good 6% annual growth and bringing a reprieve to the past two years of decline,” Shamika N. Sirimanne, Director of the Technology and Logistics Division at UNCTAD, said.
Among ICT products, trade in electronic components continued to expand with an annual growth rate of 8% – just below that of computers and consumer electronics (9%) – and is shows long-term, steady growth.

Source: UNCTADStat
“The expansion of electronic components, which are the basic building blocks of electronic circuits and semiconductors, reflects the fact that more and more products and activities are going digital worldwide. Much of this trend can be associated with the advent of the IoT, which has witnessed unprecedented growth since 2015. This trend may be further accentuated in the coming years,” Ms. Sirimanne said.
Top 10 exporters
While China is by far the largest exporter of ICT goods, the Republic of Korea boasted the highest growth rate among the top 10 exporters in 2017. Exports also grew significantly for all the other top ten exporters, except the United States. The market share of the top 10 exporters was about 86% in 2017.
Meanwhile, the United States is the top importer followed closely by China and Hong Kong (China). Mexico was the only economy among the top 10 where ICT goods imports did not grow in 2017.
The share of intra-industry trade remains high in this sector, with interdependence between the big Asian, North American and European players, and the top importers typically also feature among the top exporters of ICT goods (table 1).
| Top 10 exporters | 2017 | 2016-2017 |
1 | China | 612663 | 10% |
2 | Korea, Republic of | 141925 | 29% |
3 | China, Taiwan Province of | 139206 | 15% |
4 | Singapore | 119520 | 8% |
5 | Germany | 71682 | 15% |
6 | United States of America | 68577 | 0% |
7 | Malaysia | 67094 | 16% |
8 | Mexico | 65955 | 9% |
9 | Japan | 58298 | 9% |
10 | Netherlands | 55578 | 10% |
| World | 1632204 | 4% |
| Top 10 importers | 2017 | 2016-2017 |
1 | United States of America | 343650 | 9% |
2 | China | 329849 | 11% |
3 | China, Hong Kong SAR | 305615 | 11% |
4 | Germany | 102495 | 15% |
5 | Singapore | 91366 | 11% |
6 | Japan | 87355 | 11% |
7 | Korea, Republic of | 71861 | 13% |
8 | China, Taiwan Province of | 63923 | 18% |
9 | Mexico | 63530 | -1% |
10 | Netherlands | 62973 | 16% |
| World | 2126905 | 6% |
ICT goods imports to developed economies showed 10% annual growth while ICT goods imports to economies in transition in South East Europe, the Commonwealth of Independent States grew by 29%. This growth is significantly more than in developing economies – 3% – while in the 47 Least Developed Countries they dropped by a hefty 30%. In 2017, Eastern Asia accentuated its role as the leading export hub, while Africa, Southern and Western Asia all saw significant declines.
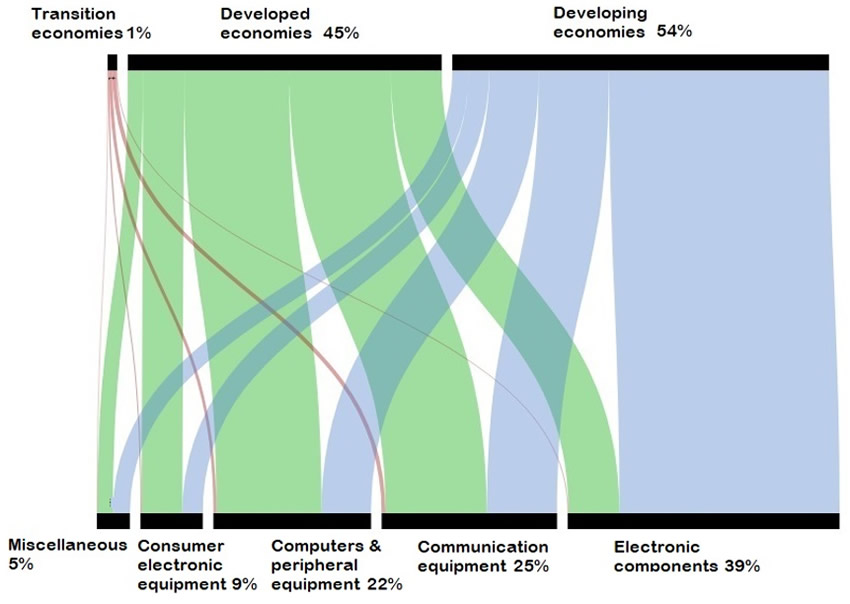
However, at 54% market share, developing economies import more than developed economies because they have a more significant role in assembling ICT goods and so import significantly more electronic components.
Developing countries also show a stronger preference for communication equipment over computers and peripherals, in line with the implementation of mobile-first strategies. On the other hand, the shopping basket is more balanced between the different ICT product categories in developed economies.
2017 | Change 2016-2017 | |||
Grouping/ Region | Exports | Imports | Exports | Imports |
Developed economies | 443564 | 950602 | 7% | 10% |
Transition economies | 3019 | 29174 | 28% | 29% |
Developing economies | 1185622 | 1147128 | 3% | 3% |
Africa | 2695 | 17660 | -13% | -12% |
Latin America and the Caribbean | 67465 | 105109 | 7% | 3% |
Asia and Oceania | 1115461 | 1024358 | 3% | 3% |
Eastern Asia | 894119 | 771447 | 14% | 12% |
Southern Asia | 2615 | 47378 | 3% | 27% |
South-Eastern Asia | 216337 | 172585 | -25% | -22% |
Western Asia | 2388 | 32787 | -12% | -26% |
LDCs | 79 | 3124 | -89% | -30% |
Source: UNCTADStat
Source: UNCTADStat