| EMBARGO The contents of this press release and the related Report must not be quoted or summarized in the print, broadcast or electronic media before 24 September 2008, 17:00 GMT (13:00 New York, 19:00 Geneva, 22:30 New Delhi, 02:00 - 25 September in Tokyo) |
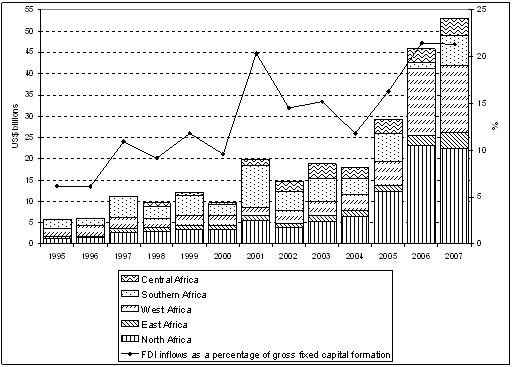
Geneva, 24 September 2008 - Africa received record foreign direct investment (FDI) inflows of US$ 53 billion in 2007 (figure 1), this year´s World Investment Report (1) reveals. The region also trumped the world´s other developing regions by providing the highest rate of returns on FDI for the past two years.
The report, subtitled "Transnational Corporations and the Infrastructure Challenge," was released today.
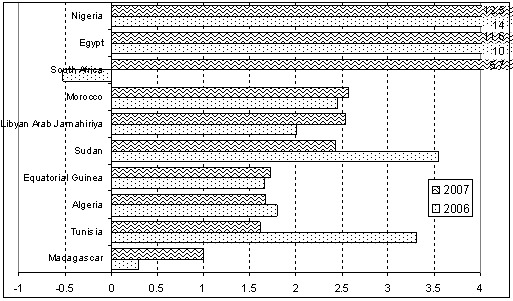
Africa´s FDI inflows in 2007 continued to be geographically concentrated: the top 10 host countries accounted for over 82% of total inflows (figure 2), and nine countries received inflows of US$ 1 billion or more. The surge in FDI to the region, and its profitability, were driven by the boom in global commodity prices and by Africa´s changing policy environment. North Africa attracted 42% and sub-Saharan Africa 58% of FDI to the region. Investment in African least developed countries (LDCs) also grew for the second consecutive year.
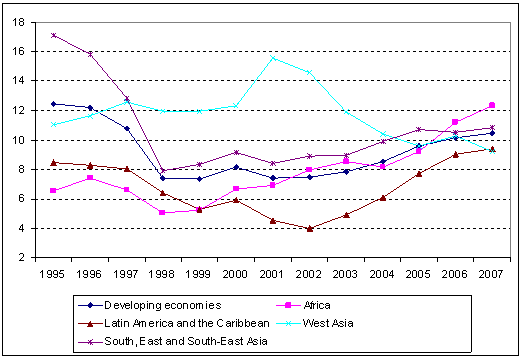
As a result of the commodity price boom, income on inward FDI grew by 31% in 2007, and the rate of return on investment in Africa was the highest among developing regions in 2006 and 2007 (figure 3). A large proportion of FDI in 2007 concentrated on expanding projects related to natural-resource exploitation, partly through reinvested earnings. Consequently, the share of reinvested earnings in total FDI inflows increased to 28%. Among the major natural-resource producers, FDI in natural-resource exploitation contributed to accelerated export growth. Foreign-exchange reserves in the region grew by some 36% in 2007, and by even more in some major oil-exporting countries such as Nigeria and the Libyan Arab Jamahiriya.
Despite higher inflows, Africa´s share of global FDI remained at about 3%. Transnational corporations (TNCs) from the United States and Europe were the main investors in the continent, followed by African investors, particularly from South Africa. TNCs from Asia concentrated mainly on oil and gas extraction and on infrastructure. Prospects for increased FDI inflows in 2008 are promising in light of continued high prices for commodities, large projects already announced for the year, and forthcoming payments from previously concluded cross-border mergers and acquisitions (M&As). This could result in a fourth consecutive year of FDI growth on the continent.
UNCTAD´s World Investment Prospects Survey 2008-2010 indicates that almost all TNCs plan to maintain or even increase their current high levels of investment in the region (see UNCTAD/PRESS/PR/2008/038).
In terms of policy measures, African governments and their partners adopted various new laws and took other steps to attract more FDI. UNCTAD´s annual survey of changes in national laws and regulations that may influence the entry of transnational corporations noted relevant policy changes in 10 African countries during 2007, most of which aimed at granting concessions to foreign investors and facilitating FDI. Countries in the region signed 11 new bilateral investment treaties (BITs) and 11 new double taxation treaties (DTTs). About 50% of the BITs and 60% of the DTTs concluded were with developed countries. Egypt concluded the largest number of BITs and South Africa the largest number of DTTs.
The World Investment Report and its database are available online at http://www.unctad.org/wir and http://www.unctad.org/fdistatistics |
ANNEX
Tables and figures
Figure 1. Africa: FDI inflows in value and as a percentage of gross fixed capital formation, 1995-2007
Source: UNCTAD, World Investment Report 2008: Transnational Corporations and the Infrastructure Challenge.
Note: [type here the text of the note, i]
Figure 2. Africa top 10 recipients of FDI inflows, a 2006-2007(Billions of US dollars)
Source: UNCTAD, World Investment Report 2008: Transnational Corporations and the Infrastructure Challenge.
Note: a- Ranked by magnitude of 2007 FDI inflows
Figure 3. Rates of return on inward FDI, by developing regions, 1995-2007(per cent)
Source: UNCTAD, World Investment Report 2008: Transnational Corporations and the Infrastructure Challenge.
Note: Rate of return is calculated as income for the current year, as measured by balance-of-payments data on outflows of direct-investment income divided by the average of FDI stock of the previous year and the current year.


