| EMBARGO The contents of this press release and the related Report must not be quoted or summarized in the print, broadcast or electronic media before 16 October 2007, 17:00 GMT (1PM New York, 19:00 Geneva, 22:30 New Delhi, 02:00 17 October Tokyo) |
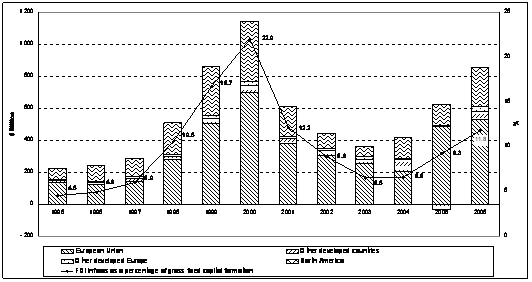
Foreign direct investment (FDI) inflows to developed countries grew by 45% to reach US$857 billion in 2006 (figure 1), UNCTAD reports in its annual survey of global investment trends.
World Investment Report 2007(1) notes that in contrast to the last significant increase in FDI to industrialized nations, which occurred at the end of the past decade, the current jump covered all developed regions and economic sectors. The surge was mainly driven by cross-border mergers and acquisitions (M&As), with the increasing involvement of private equity funds, and reflected higher stock market valuations, rising corporate profits, and favourable financing conditions in 2006.
This year´s report is subtitled Transnational Corporations, Extractive Industries, and Development.
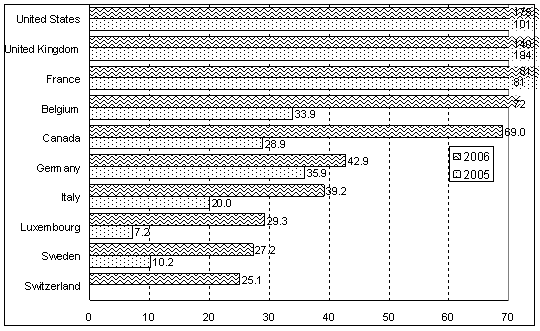
Inward FDI to the United States rebounded to $175 billion (figure 2) boosted by an all-time high in reinvested earnings of $65 billion. Although inflows to the United Kingdom fell by 28% in 2006, that country was still the world´s second largest FDI recipient. While France recorded a small increase in inflows to $81 billion, FDI into Belgium more than doubled to $72 billion. A wave of cross-border M&As in the mining sector doubled Canadian inflows to a record of $69 billion. Other major FDI recipients included Germany, Italy, Luxemburg and Sweden. Inflows to the 10 new member countries of the European Union amounted to $39 billion - their highest level ever. Due to some large sell-offs of foreign affiliates to Japanese companies, FDI inflows to Japan turned negative for the first time since 1989 (-$6.5 billion). Nearly 90% of M&As in developed countries were concluded by firms from other developed countries, although developing-country firms invested up to $68 billion in acquisitions in developed countries - a 57% increase over 2005.
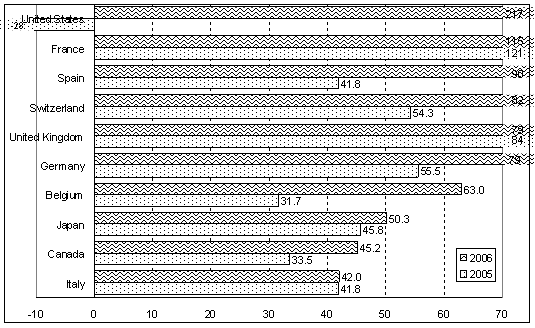
Developed countries continued to maintain their position as net providers of FDI, with 2006 outflows rising by 45% to $1 trillion. FDI flows from the United States jumped to $217 billion after negative outflows were registered in 2005 (figure 3). The 2005 decline resulted from the repatriation of profits induced by one-off tax incentives provided by the American Jobs Creation Act. While France remained the second largest investor worldwide for the second year in a row ($115 billion), the next two investors - Spain and Switzerland - reached new records. Of the three largest cross-border M&As in 2006, two originated in Spain while acquisitions by Swiss companies in North America doubled FDI outflows from that country to $82 billion. FDI outflows from the Netherlands amounted to $23 billion, mainly due to the acquisition of Arcelor (Luxembourg) by Mittal Steel (a company registered in the Netherlands) - the largest deal of the year.
While ongoing financial deregulation was the main reason for a significant increase in cross-border M&As in the financial services sector, high commodity prices and consolidation efforts spurred M&As in the mining industry. Many developed countries adopted policies that could -- directly or indirectly -- increase their attractiveness to FDI: of the 37 changes recorded by UNCTAD in developed-country regulatory frameworks affecting FDI, 30 aimed at facilitating more such investment, including privatization (Latvia, Malta), liberalization efforts (EU Directive on Services in the Internal Market, media in Australia), and tax cuts (Austria, the Czech Republic, Estonia, Greece, and the Netherlands). However, some protectionist sentiment remains or is again on the rise in certain developed countries. In the United States, for example, steps were taken to ensure that foreign investments do not jeopardize national security.
The report projects further growth of FDI to developed countries, albeit at a more moderate pace than in 2006. Continued high equity prices and corporate profits, and ongoing economic growth are expected to stimulate cross-border M&As and FDI, although current risks facing the world economy require the need for caution in assessing future FDI prospects.
The World Investment Report and its database are available online at http://www.unctad.org/wir and http://www.unctad.org/fdistatistics |
ANNEX
Tables and figures
Figure 1. Developed countries: FDI inflows and their share in gross fixed capital formation, 1995-2006
Source:UNCTAD, World Investment Report 2007
Figure 2. Developed countries: FDI inflows, top 10 economies, 2005-2006a(Billions of dollars)
Source: UNCTAD, World Investment Report 2007
Note: a Ranked on the basis of the magnitude of the 2006 FDI inflows.
Figure 3. Developed countries: FDI outflows, top 10 economies, 2005-2006a(Billions of dollars)
Source: UNCTAD, World Investment Report 2007
Note: a Ranked on the basis of the magnitude of the 2006 FDI outflows.


