| EMBARGO The contents of this press release and the related Report must not be quoted or summarized in the print, broadcast or electronic media before 16 October 2006, 17:00 GMT (1 PM New York, 19:00 Geneva, 22:30 Delhi, 02:00 - 17 October Tokyo) |
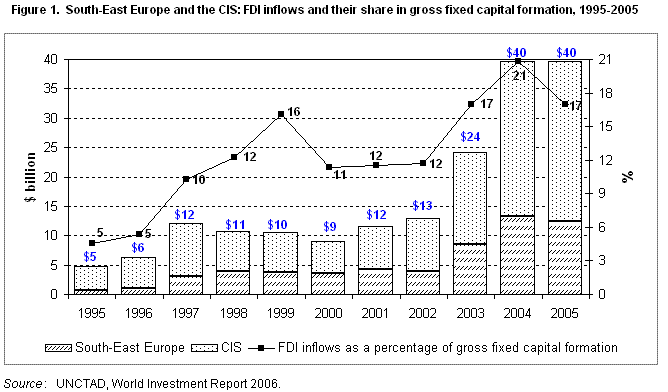
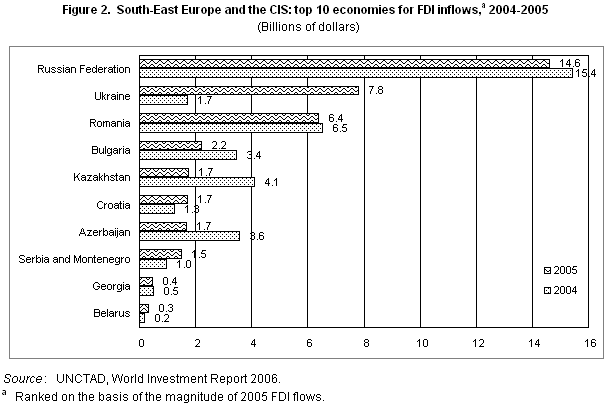
Foreign direct investment (FDI) flows to South-East Europe and the Commonwealth of Independent States (CIS) in 2005 totalled US$40 billion, almost the same level as in 2004 (figure 1), according to UNCTAD´s World Investment Report 2006, FDI from Developing and Transition Economies: Implications for Development (1) . However, these flows were concentrated in three countries: the Russian Federation, Ukraine and Romania, in order of quantity, accounted for three-quarters of total FDI to the region (figure 2). In each, FDI inflows exceeded US$5 billion. Inflows rose in 8 of the region´s countries overall (most notably the Ukraine) and fell in 11.
After a peak in 2004 due to large oil and gas projects, inflows to Azerbaijan and Kazakhstan decreased markedly. They also declined marginally in the Russian Federation, which nevertheless remained the largest recipient of inward FDI. Russian FDI spanned a range of activities, from natural resources in the primary sector through certain manufacturing operations (such as Coca Cola´s US$501 million investment in food and beverages) to services (such as the US$1.3 billion real estate and trading project undertaken in St. Petersburg by Baltic Pearl of China). In the Ukraine, the re-privatization of the Kryvorizhstal iron and steel factory led to its purchase by Mittal Steel (Netherlands/United Kingdom), a transaction valued at US$4.8 billion - the largest deal in the country and the CIS so far. Aval Bank was acquired by Raiffeisen International (Austria) for US$1 billion (re-sold to Hungary´s OTP in 2006). In South-East Europe, large inflows to Romania and Serbia and Montenegro were explained in part by several privatization deals in banking (such as the acquisition of Banca Comerciala Romana by Erste Bank (Austria) in Romania, and of Kontinental Banka by Nova Ljubljanska Banka (Slovenia) in Serbia and Montenegro). In addition, in Romania, the privatization of natural gas providers and their purchase by Gaz de France and Ruhrgas (Germany), worth US$0.7 billion, were responsible for a large proportion of the country´s increase in FDI inflows.
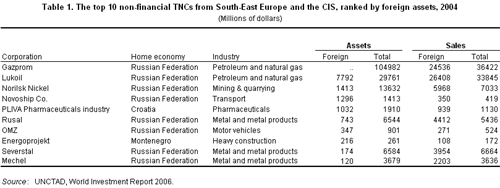
FDI outflows from the region grew for a fourth consecutive year, reaching US$15 billion, with the Russian Federation alone responsible for 87% of the total. Oil prices and competition for resources in 2005 prompted Russian transnational corporations (TNCs) to maintain high levels of FDI abroad (see table 1 for the 10 largest TNCs based in the region). In particular, the Russian TNC Lukoil paralleled the purchase of the Canadian-based oil company Petrokazakhstan by China´s CNPC with the acquisition of another Canadian-based oil company, Nelson Resources. Russian firms were also active in other natural resources such as aluminium: RusAl became a joint-venture refinery partner in Australia in 2005, while the electricity company UES won a privatization bid for power stations in Bulgaria. Aside from the Russian Federation, only Azerbaijan had outflows exceeding US$1 billion in 2005. Most of the Azerbaijani outflow was related to the construction of the Baku-Tbilisi-Ceyhan pipeline, in which the State Oil Company of Azerbaijan has a 25% share.
In natural-resource-based economies, such as the Russian Federation, most policy issues concern management of windfall earnings from high international oil prices, and the definition - or redefinition - of the economic role of the State. For example, the Government of the Russian Federation increased its share to a majority stake in one of the largest outward investing TNCs, Gazprom, a gas firm, and acquired a major outward investing oil firm (Sibneft).
| The World Investment Report and its database are available online at http://www.unctad.org/wir and http://www.unctad.org/fdistatistics |
ANNEX
Tables and figures
Figure 1. South-East Europe and the CIS: FDI inflows and their share in gross fixed capital formation, 1995-2005
Source: UNCTAD, World Investment Report 2006
Figure 2. South-East Europe and the Commonwealth of Independent States: top 10 economies for FDI inflows,a 2004-2005 (Billions of dollars)
Source: UNCTAD, World Investment Report 2006
Note: a Ranked on the basis of the magnitude of the 2005 FDI inflows.
Table 1. The top 10 non-financial TNCs from South-East Europe and the CISa, ranked by foreign assets, 2004 (Millions of dollars)
Source: UNCTAD, World Investment Report 2006
Note:a All data are based on the companies´ annual reports unless otherwise stated. Data of affiliates are from D&B Who Owns Whom database.


