| EMBARGO The contents of this press release and the related Report must not be quoted or summarized in the print, broadcast or electronic media before 16 October 2007, 17:00 GMT (1PM New York, 19:00 Geneva, 22:30 New Delhi, 02:00 17 October Tokyo) |
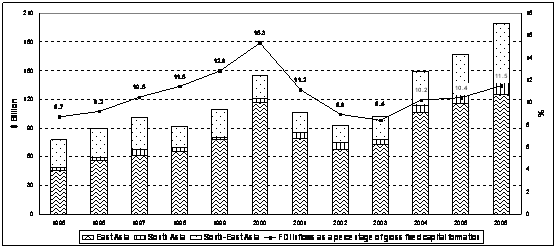
FDI inflows to South, East, and South-East Asia maintained their upward trend in 2006, rising by about 19% to reach a new high of US$200 billion (figure 1), reports UNCTAD´s annual survey of global FDI.
World Investment Report 2007: Transnational Corporations, Extractive Industries and Development (1) indicates that at the subregional level, South and South-East Asia saw sustained increases in flows, while FDI growth in East Asia was slower. However, foreign investment in that subregion is shifting towards more knowledge-intensive and high-value-added activities, the report notes.
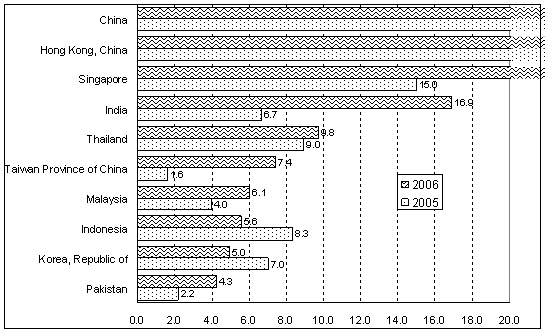
China and Hong Kong (China) retained their positions as the largest FDI recipients in the region, followed by Singapore and India (figure 2). Inflows to China fell in 2006 for the first time in seven years. The modest decline (by 4% to $69 billion) was due mainly to reduced investments in financial services. Hong Kong (China) attracted $43 billion in FDI, Singapore $24 billion (a new high), and India $17 billion -- an amount equivalent to India´s preceding three years of inflows.
The primary and services sectors in the region received significantly higher FDI inflows in 2006. In extractive industries, the value of cross-border M&As rose nearly fivefold to $1.7 billion. In services, increases were notable in, for instance, retailing in China, telecommunications in Thailand, transportation in Hong Kong, and banking in India, Taiwan Province of China and Viet Nam. But FDI related to mergers and acquisitions (M&A) in manufacturing dropped.
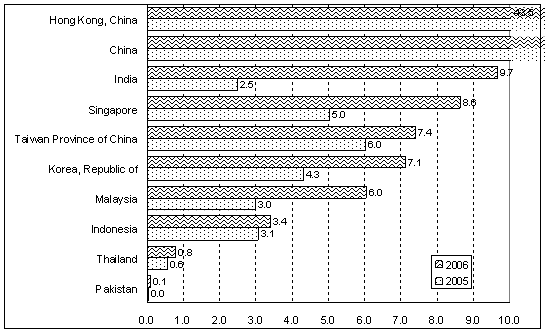
FDI outflows from the region as a whole rose by 60% to $103 billion in 2006, with higher investments coming from all subregions and major economies. Outflows from Hong Kong (China), the largest source of FDI in the region, rose by 60% to $43 billion (figure 3). China consolidated its position as a major investor, and India is rapidly catching up. Their emergence as important sources of FDI is challenging the dominance of the Asian newly industrializing economies in outward FDI from the region. Resource-seeking FDI from China and India continued to increase. In addition, the efforts of Chinese state-owned enterprises and of Indian privately owned conglomerates to acquire strategic assets abroad -- as highlighted by the $11 billion acquisition by Tata Steel (India) of Corus Group (United Kingdom and the Netherlands) -- have led to greater FDI flows from these countries to developed economies.
Rapid economic growth in South, East, and South-East Asia should continue to fuel increased market-seeking FDI to the region, the report predicts. The region will also become more attractive to efficiency-seeking FDI, as countries such as China, India, Indonesia and Viet Nam plan to significantly improve their infrastructures. During the first half of 2007, the value of cross-border M&A deals in the region increased by nearly 20% over the corresponding period in 2006. Increased FDI outflows from the region are also expected to continue.
The World Investment Report and its database are available online at http://www.unctad.org/wir and http://www.unctad.org/fdistatistics |
ANNEX
Tables and figures
Figure 1. South, East and South-East Asia: FDI inflows and their share in gross fixed capital formation, 1995-2006
Source: UNCTAD, World Investment Report 2007
Figure 2. South, East and South-East Asia: FDI inflows, top 10 economies, 2005-2006a(Billions of dollars)
Source: UNCTAD, World Investment Report 2007
Note: a Ranked on the basis of the magnitude of the 2006 FDI inflows.
Figure 3. South, East and South-East Asia: FDI outflows, top 10 economies, 2005-2006a(Billions of dollars)
Source: UNCTAD, World Investment Report 2007
Note: a Ranked on the basis of the magnitude of the 2006 FDI outflows.


