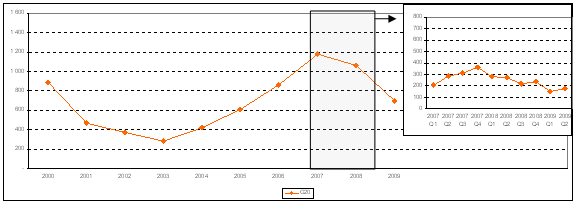
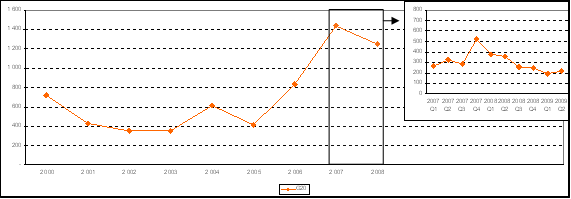
G20 countries (1) accounted for around two-thirds of both global FDI outflows and inflows between 2007 and 2009, an UNCTAD survey reveals. Outward and inward FDI flows of these countries declined by 10% and 13%, respectively, in 2008, as compared to 2007 (figures 1 and 2). This decline continued during the first half of 2009, UNCTAD said, leading to bleak prospects for the year.
First half of 2009: strong impact felt from global economic and financial crisis
Since the beginning of 2009, the impact of the financial and economic crisis, which intensified in October 2008, has dealt a sharp blow to FDI flows. As compared to the last quarter of 2008, G20 inward and outward FDI decreased by 37% and 22%, respectively, in the first quarter of 2009.
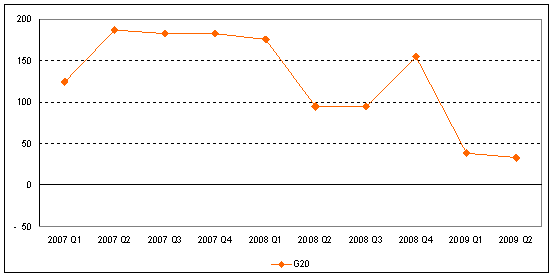
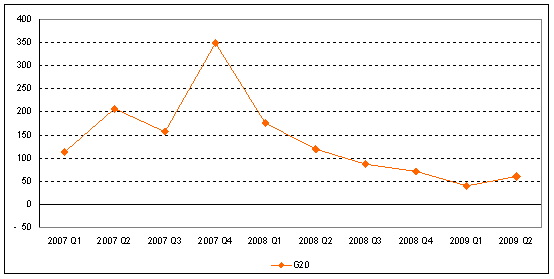
As in 2008, the drop in the value of cross-border mergers and acquisitions (M&As) is the major driving force behind this additional decline in FDI. Shrinking corporate profits and plummeting stock prices have greatly diminished the value of, and scope for, these kinds of operations. M&A purchases and sales by the G20 fell by 66% and 74%, respectively, in the first half of 2009 as compared to the same period the previous year (figures 3 and 4).
Transnational corporations (TNCs) have been hit by the consequences of the global economic slowdown, UNCTAD said, leading to falling market expectations, tighter credit conditions, reduced value of assets following stock market declines, and falls in corporate profits. At the same time, TNCs have been confronted by major uncertainties about the evolution of the economic situation in the short term.
As a consequence, many TNCs have announced plans to curtail output, lay off workers and cut capital expenditures, all of which have implications for FDI. According to the results of UNCTAD´s World Investment Prospects Survey 2009-2011, nearly two-thirds of respondent TNCs anticipate a decline in their FDI expenditures this year.
Preliminary data for the second quarter paints a mixed picture. During this quarter cross-border M&As in the G20 appear to have stabilized, but at a relatively low level compared to 2008 (down 65% for sales and 49% for purchases, compared with the same period last year). FDI data, while still incomplete, suggest that inflows to the G20 were down by roughly 34% from the same period last year, but were up compared to the previous quarter (figure 1). However, the component structure of FDI flows in this period does not bode well for prospects: increases in intra-company loans - one of the components which are normally of a transitory nature - contributed to the rise of flows by making up for a strong decline in equity flows (another component of FDI inflows). Weak equity flows are clearly reflected in the low level of cross-border M&As.
The rest of 2009: prospects for a pickup in FDI flows remain unlikely
Some signs of a still fragile global economic recovery have popped up in recent months. According to the latest IMF analysis, (2) the world economy is beginning to slowly escape from the worst recession experienced in the post World War II era. Corporate profits of the largest TNCs continued to rebound in the second quarter of 2009 after a sharp drop in the fourth quarter of 2008. While it is possible that these evolutions will positively influence FDI flows in the coming months, the forecast for the whole year remains one of decline, UNCTAD said.
Even with a potential mellowing in the decline of FDI flows, inflows for the G20 in the first half of 2009 were still roughly 40% below 2008 levels. Thus, FDI inflows to the 19 members of the G20 in 2009 are likely to be around US$700 billion, while those to the world - of which the G20 constitute the bulk - will be between US$900 to US$1,200 billion.(3)
Policy implications
These FDI trends raise questions about the policies that are needed to maximize the potential of foreign investment to achieving a sustainable global recovery. First, there is a need for a favourable investment climate, including effective investment promotion and attendant international cooperation. This is particularly important given the many emergency response measures -- including large stimulus packages -- and their impact on FDI flows (e.g., divestments, including from developing countries). Second, current efforts towards institutional reform of the global financial system also raise the need for ensuring coherence between this system and the international investment regime (the latter consists of more than 5,600 international investment and investment-related treaties). Both regulate global long-term and short-term capital movements. And third, there is need to ensure that current endeavours against investment protectionism do not remain one-off initiatives. The thrust of G20 policy changes in the investment area has been, for the most part, towards greater openness and clarity, as documented by UNCTAD´s Report on "Investment Policy Developments in G20 countries" during the global economic crisis (covering the period October 2008 to February 2009)(4), and the joint WTO-OECD-UNCTAD Report on "G20 Trade and Investment Measures" (covering the period April-August 2009).(5) However, continued international monitoring, such as that undertaken by UNCTAD, the Organization for Economic Cooperation and Development (OECD) and the World Trade Organization (WTO) can play an important role, particularly when the current crisis begins to ease and the expected exit of public investment may trigger new tendencies towards economic nationalism.
ANNEX
Tables and figures
Figure 1. G20 FDI inflows, 2007-2009, by quarter (Billions of US dollars)
Figure 2. G20 FDI outflows, 2007-2009, by quarter (Billions of US dollars)
Figure 3. G20 net cross-border M&A sales, 2007-2009, by quarter (Billions of US dollars)
Figure 4. G20 net cross-border M&A purchases, 2007-2009, by quarter(Billions of US dollars)


