
Geneva, 2 February 2011 - New UNCTAD data released today reveal that Asian economies in 2009 accounted for 66.3 per cent of global exports of information and communication technology (ICT) goods, up from 63.8 per cent in 2008. That supports recent findings that the global financial crisis has led to significant shifts in world trade of ICT goods towards Asia. More than one third of world ICT goods exports now originate in China and Hong Kong (China) (figure 1).
Global ICT exports, which represented 12 per cent of world merchandise trade in 2009, are increasingly dominated by Asia. Seven of the top ten exporters are Asian economies (figure 1). China is by far the largest, with ICT goods exports amounting to $356 billion in 2009, followed by Hong Kong (China) ($142 billion), and the United States ($113 billion).
ICT goods are of great significance for many developing economies, especially in Asia (table 1). Reliance on ICT products is most pronounced in the case of Hong Kong (China), where such items represent more than 43 per cent of all merchandise exports. Other economies in which ICT goods make up 30 per cent or more of exports include China, Singapore, the Republic of Korea, Taiwan Province of China, and the Philippines.
While ICT exports from most major exporters fell in 2009 as a result of the financial crisis, the decline was particularly pronounced among several European countries (figure 2). For example, ICT exports dropped by more than half in Portugal and Finland, by 36 per cent in Ireland, and by more than 20 per cent in the Czech Republic, France, Germany, and Sweden. Japan and the United States also saw sharp declines. At the other end of the spectrum, a few economies saw increases. India´s exports increased by a whopping 244 per cent, and those of Malaysia by 18 per cent. Moreover, declines in exports experienced by China, Hong Kong (China), the Philippines, the Republic of Korea, and Thailand were relatively modest.
In terms of ICT goods imports, the United States tops the list, followed by China and Hong Kong (China) (table 1). Among major importers, declines of more than 35 per cent were registered in 2009 by Finland, Ireland, Portugal, the Russian Federation and Spain. India, on the other hand, experienced a rapid increase in ICT goods imports, moving from 28th to 17th in the global ranking of importers.
Economies for which ICT goods represent large shares of their imports are mainly found in East and South-east Asia, which are part of global value chains related to ICT products. A few Latin American countries also report a high reliance on ICT goods imports, including Costa Rica (17 per cent), Mexico (20 per cent) and Paraguay (26 per cent).
On-line UNCTAD data on the information economy In the context of the Partnership on Measuring ICT for Development(1), UNCTAD is responsible for core indicators related to the information economy. Two core indicators concern trade in ICT goods:
Data for 2008 and 2009 on trade in ICT goods can be accessed free of charge at https://unctadstat.unctad.org/datacentre?folders=19. They reflect the new OECD definition of ICT goods and are based on the United Nations COMTRADE database. Data for 124 countries in 2009 and 147 in 2008 are available. For more information, please contact Emeasurement@unctad.org. |
ANNEX
Tables and figures
Table 1. Top 20 exporters and importers of ICT goods in 2009
Source: UNCTAD calculations, based on UN DESA Statistics Division, United Nations COMTRADE. (See https://unctadstat.unctad.org/datacentre?folders=19 )
Figure 1. Top 10 exporters of ICT goods,(percentage share of world exports of ICT goods)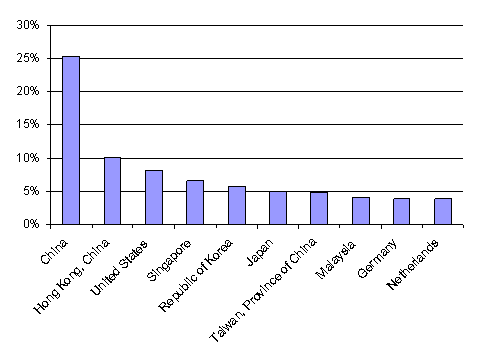
Source: UNCTAD calculations, based on UN DESA Statistics Division, United Nations COMTRADE. (See https://unctadstat.unctad.org/datacentre?folders=19 )
Figure 2. Growth rate of ICT goods exports between 2008 and 2009, selected economies (%)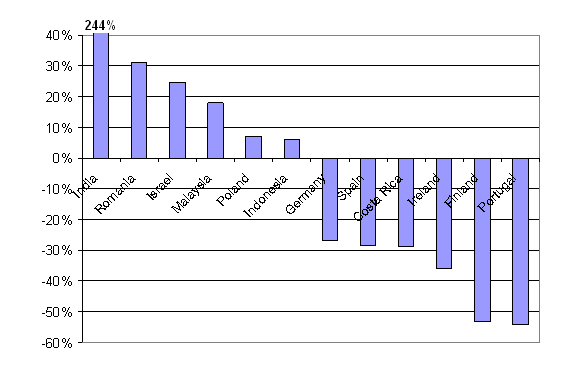
Source: UNCTAD calculations, based on UN DESA Statistics Division, United Nations COMTRADE. (See https://unctadstat.unctad.org/datacentre?folders=19 )