
Trade under hyperglobalization has failed to foster broad-based structural change in developing countries and has contributed to increased worldwide inequality, a new report from UNCTAD shows.
Empirical research in the report suggests that the surge in the profitability of top transnational corporations, together with their growing concentration, has acted as a major force pushing down the global income share of labour, thus exacerbating income inequality.
The report also expresses concern that the kind of policies that have helped China to successfully diversify and upgrade are now being singled out for retaliatory action by advanced countries whose transnational corporations see such policies as a threat to their bottom line.
“Recent heightened anxiety in developed countries, which have been among the growing number of casualties of hyperglobalization, has led to some questioning of the official story of the shared benefits of trade,” UNCTAD Secretary-General Mukhisa Kituyi said, launching the Trade and Development Report 2018: Power, Platforms and the Free Trade Delusion. These worries add to longer-standing concerns among developing countries about the workings of the international trading system.
“Reviving optimism about trade and multilateralism must go beyond simply promoting trade for trade’s sake,” Dr. Kituyi said, adding that the report argues for a more inclusive trade and development narrative and agenda.
Limited trade-induced structural change
While the growing importance of developing countries in international trade – including increased trade with each other – has been an important part of recent debates on globalization, the report acknowledges that the “rise of the South” is primarily an East/South-East Asian story.
The report finds that the rapid growth of exports from the first-tier of newly industrialized economies in Asia and subsequently (and more dramatically) from China was associated with a reduction in developed countries’ share in world exports, from nearly three-quarters of gross merchandise exports in 1986, to just over one-half in 2016. During this period, in most other developing countries, export shares remained roughly constant or sometimes even declined, except during the temporary rising phase of the commodity price super-cycle.
China even stands out among the BRICS. Excluding China, the share of the Russian Federation, India, Brazil and South Africa in global output went up from 3.7 per cent in 1990, to around 7.4 per cent in 2016 – an increase, but not a spectacular one. By contrast, when China is added, the share of BRICS increases from 5.4 per cent to 22.2 per cent during this period.
This is particularly the case with manufacturing activity. In 2016, East Asia accounted for 7 out of every 10 dollars earned by the developing world from exports of manufactures. Moreover, since 1995, it is only East-Asian developing economies that house, to any significant degree, the headquarters of leading transnational corporations, registering a rising share of profits generated by the world’s top 2,000 transnational corporations, from 7 per cent in 1995 to more than 26 per cent in 2015.
As more developing countries have come to rely on global markets they have also, the report finds, become more dependent on a narrow range of exports: hyperspecialization has become a feature of the trading system under hyperglobalization.
The report associates this with the spread of global value chains and the difficulties of climbing the development ladder in absence of a strong “developmental state”. These chains have been a longstanding feature of commodity trade and it is no surprise that since 1995, 18 of 27 developing countries for which we have data have experienced increases in the share of extractive industries in export value added.
But, with the notable exception of China, the spread of global value chains into manufacturing and service activities has gone hand in hand with a declining share of domestic value added in gross exports. The report finds little clear evidence of upgrading in these chains, again with exceptions in East Asia (figure 1).
So far, the growing demand of China, which helped spur growth in many developing countries from the start of the millennium, has not triggered significant positive changes in the export structure of other developing countries.
Trade as an unequalizing force
When it comes to corporate behaviour, size matters, abroad as much as at home. Trade is dominated by big firms, increasingly so since the mid-1990s; among exporting firms, the top 1% accounted, on average, for 6 out of every 10 dollars of exports. On some estimates just 10 firms, on average, account for 4 out of every 10 dollars earned abroad.
In this winner-takes-all world, it is not surprising that new entrants and smaller exporters have a low survival rate, with three out of four firms dropping out of the export business after two years and with firms in developing countries faring worse than in developed countries.
The worsening of trade-related inequality reflects a combination of elevating profits from intangible assets, higher incomes creamed off by headquarters and squeezing costs in production. And size again matters when it comes to profitability; the rapid growth of profits of the top 2,000 firms is seen as a major force pushing down the global labour income share.
Hollowing out (by offshoring) is a familiar story in advanced economies, but the report also tracks a squeezing of income shares of low and medium skill workers in production stages of value chains in developing countries as the share of value added in fabrication has declined. China is a notable exception (table).
Many of these big international firms engage in what has been called “phantom trade” involving the movement of intangible assets and their related income flows to low-tax or no-tax jurisdictions. This is particularly true of payments and receipts for intellectual property which have risen precipitously since the early 2000s in countries such as Ireland, Luxembourg, the Netherlands and Switzerland, with an attendant increase of income accruing to transnational corporations from direct investment in these locations, which is far bigger than in the countries where they make and sell their products (figure 2).
Taking policy space seriously
The problem, the report concludes, is not with trade as such but with how it is managed. Easy talk of a win–win world all too often ignores the general conditions required for broadly shared benefits and denies the realities of today’s winner-takes-most world.
Policy space has been squeezed by free trade agreements, with increasingly intrusive provisions which reflect the hand of large exporters in opaque negotiation processes. According to the report, such agreements are increasingly becoming a mechanism for promoting rent-seeking by large exporting firms, especially through provisions pertaining to intellectual property rights, cross-border capital flows, investor–State dispute settlement procedures and the harmonization of regulatory standards, and more, which have little to do with trade in the strict sense. Significantly, the report notes, South–South trade agreements are less susceptible to such abuses of corporate power.
Figure 1 - Export structure by technological levels, selected developing regions, 1990–2016
(Percentage and trillion of dollars)
Source: UNCTAD secretariat calculations, based on Comtrade database.
Note: The product classification comes from UNCTAD Trade and Development Report, 2002.
a South, South-East and East Asia does not comprise China and newly industrialized economies (both tiers).
Table - Shares in exported value added in manufacturing global value chains, 2000–2014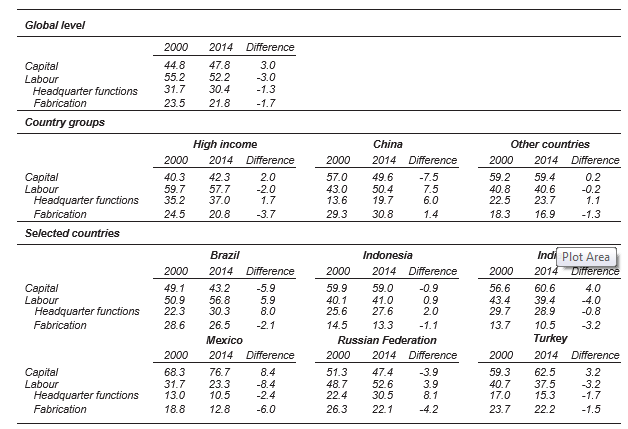
Source: UNCTAD secretariat calculations, based on World Input–Output Database (2016).
Note: World Input–Output Database (2016 release) includes 43 countries plus one category for the “rest of the world”, which is only included in the global aggregate figures. “High income” covers 34 countries, including the high-income developing economies of the Republic of Korea and Taiwan Province of China. “Other countries” includes two developed countries (Bulgaria and Romania) and six developing countries and transition economies (Brazil, India, Indonesia, Mexico, the Russian Federation and Turkey). All manufacturing sectors are included.
Figure 2 - Income of the United States on direct investment abroad, selected countries, first quarter 2000 to first quarter 2018
(Billions of dollars)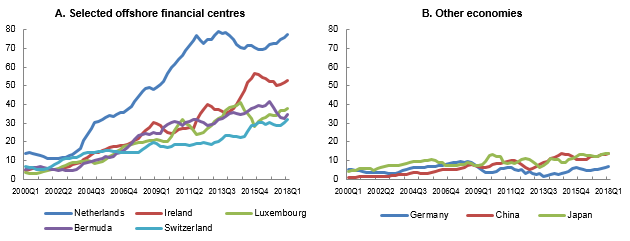
Source: Setser and Frank, 2018, based on United States Bureau of Economic Analysis.
Note: Data correspond to the four-quarter trailing sum.