
Below are highlights and figures on Latin America and the Caribbean (LAC) from UNCTAD’s Review of Maritime Transport 2020 released today and the organization’s other analyses.
Impact of COVID-19
- UNCTAD estimates LAC’s merchandise trade to have collapsed by 21% (exports) and 33% (imports) during Q2 of 2020. Relative improvement was noted in July 2020, when imports were estimated to have fallen by 24% and exports by 12%, still point to significant drops.
- The decline in the number of ship calls was severe in Latin America (-11.7%) during the first half of 2020. While container port calls fell by 4.1%, calls by Ro/Ro vessels and passenger vessels fell by 16.6% and by 26.3%, respectively. Port calls by dry bulk carriers declined by 26.6% while calls by wet bulk carriers reduced by 10.8%.
- Container ports in LAC showed signs of strength as their liner shipping connectivity levels remained steady and, in some cases, increased during the early days of the pandemic. Exports of food products may partly explain this trend. Furthermore, liner shipping connectivity data for LAC suggest that the COVID-19 pandemic did not severely hit the region during the first and second quarters of 2020. Slight decreases were observed in some countries in the region during Q3.
- Despite the resilience shown in terms of liner shipping connectivity, the maritime supply chain in LAC faced challenges like in other parts of the world. These include difficulties in securing the presence of personnel and movement of cargoes to/from ports to the mainland. Impacts have varied widely, even for ports within the same region, with transshipment ports being affected the most.
- The report’s special chapter relaying experiences from the field on the impact of COVID-19, includes a case study on the Panama Canal Authority. It notes that the Authority is as resilient as its personnel, who adapted to the new normal quickly, including new safety protocols, challenges related to telecommuting and the uncertainty caused by the pandemic. Among the important lessons learned is that everything is subject to constant and ongoing improvement, with frequent adjustments required due to the fluid situation.
- The Panama Canal registered 51 blank sailings linked to the pandemic from January to June 2020. This represented a 3% decline in container traffic from April to June 2020, compared with the same period in 2019.
- Transits through the Panama Canal dropped by 10.2%, with 2,707 transits registered between April and June 2020, compared with 3,013 transits during the same period in 2019. The drop stems from the significant impact of the pandemic on vehicle carriers as car manufacturers in Asia were shut down while demand in the United States soared. Similar patterns were observed in refrigerated products. Also, the demand for oil and oil products fell sharply because of lockdown measures and consequent declines in the need for electricity generation. Passenger vessels, vehicle carriers, refrigerated containers, tankers and liquefied natural gas carriers were affected the most.
Demand (GDP, merchandise trade, maritime cargo): key trends in seaborne trade and port cargo traffic
- In 2019, LAC loaded 12.5% of world maritime trade volume and unloaded 5.6%. The region represented 21.6% of total goods loaded in developing regions and 8.6% of goods unloaded in developing regions. Sub-regional participation in Latin America and the Caribbean region’s maritime trade in 2019 is shown in figure 1 below.
Figure 1 - Sub-regional participation in Latin America and the Caribbean region’s maritime trade, 2019
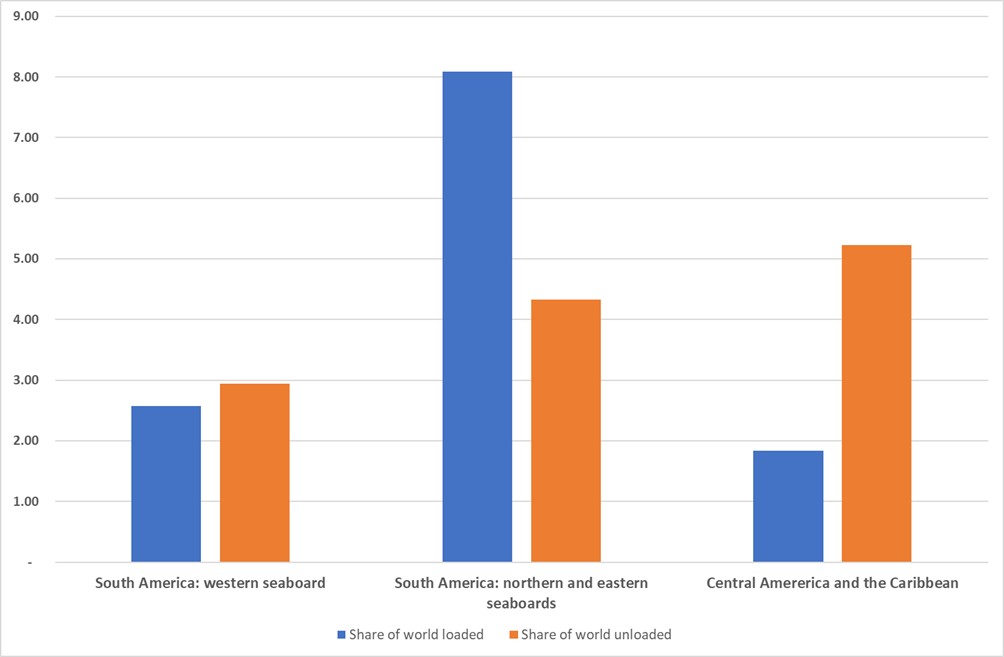
Source: UNCTAD, https://unctadstat.unctad.org/datacentre/dataviewer/US.SeaborneTrade
- During 2019, GDP growth in LAC contracted by 0.3%, as economic growth in LAC the region was hindered by adverse domestic and global conditions. In 2019, GDP growth in the region contracted by 0.3%. These challenging economic trends in Argentina, recession in Brazil and social unrest in Chile constrained cargo volumes in ports across LAC. However, some ports such as Freeport in the Bahamas; Itajaí, Sao Francisco do Sul and Paranaguá in Brazil; and two Panama Pacific terminals recorded positive growth.
- Container ports in LAC handled about 53 million twenty-foot equivalent units (TEUs) in 2019. This amounted to 6.5% of global container port traffic. It reflected a marginal annual growth of 0.7% compared to 2018.
- A significant proportion of container volumes in the region is handled at port terminals controlled by shipping companies that are part of the three major alliances – 2M, Ocean Alliance and THE Alliance.
Shipping fleet developments, connectivity and port performance
- Fleet ownership by LAC countries is limited, representing 1.26% of the global carrying capacity. Only Bermuda features among the top 35 ship-owning nations, with a share of 2.95%, and ranks ninth in terms of the deadweight tonnage carrying capacity owned.
- LAC represents 21.5% of world ship registration. Panama is the leading flag of registration by deadweight tonnage, accounting for 16% of the global carrying capacity (as of 1 January 2020). Panama is also the leading country by value of ships registered under its flag. Other countries that feature among the top 35 leading flags of registration are – by their share of deadweight tonnage – Bahamas, Bermuda, Antigua and Barbuda and the Cayman Islands.
- LAC countries with the highest maritime connectivity include – by their ranking on UNCTAD's liner shipping connectivity index as of Q3 2020 – Panama, Colombia, Mexico, Peru and Ecuador. The top five ports on UNCTAD’s liner shipping connectivity index (LSCI) for the LAC region from the first quarter of 2006 to the third quarter of 2020 are presented in figure 2 below.
Figure 2 - The top 5 ports in Latin America and the Caribbean, first quarter 2006 to third quarter 2020
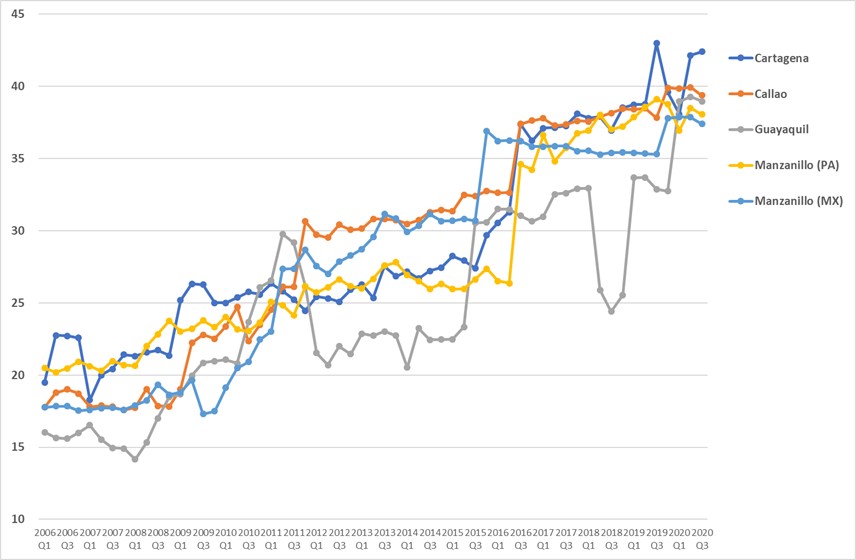
Source: UNCTAD calculations, based on data provided by MDS Transmodal.
The LSCI of all ports: https://unctadstat.unctad.org/datacentre/dataviewer/US.PLSCI
- Neighbouring ports are generally the most connected to each other. These intraregional connections do not necessarily carry trade between neighbouring ports, but the high connectivity is the result of being connected to the same overseas routes, in combination with feedering and transshipment services. In South America, Buenos Aires, Argentina is most connected to Montevideo, Uruguay (13 companies) and in Brazil, 14 companies provide direct services between Paranaguá, Rio de Janeiro and Santos. Ten companies connect San Antonio, Chile with Callao, Peru, while 15 companies connect Callao, Peru with Guayaquil, Ecuador and 12 companies provide direct services between Cartagena, Colombia and Manzanillo, Panama.
- A few small island developing states (SIDS) in the region, including the Bahamas and Jamaica, have positioned their ports as transshipment hubs and increased their attraction as ports of call. The additional fleet deployment stemming from transshipment can be used for shipments of national importers and exporters. Nonetheless, most SIDS continue to experience low levels of connectivity, suffering a lack of improvement over the years.
- The top 25 countries in container port calls for 2019 include two LAC countries, namely Brazil and Panama, with Brazil showing a median time in port of 0.73 days (or 17.5 hours) and Panama recording 0.63 days (or 15.1 hours), below the global average port call time of 0.69 days. Latin America and the Caribbean region’s percentage shares in world port calls (arrivals), vessel types in 2018 and 2019 are presented in figure 3 below.
Figure 3 - Latin America and the Caribbean region’s percentage shares in world port calls (arrivals), vessel types in 2018 and 2019
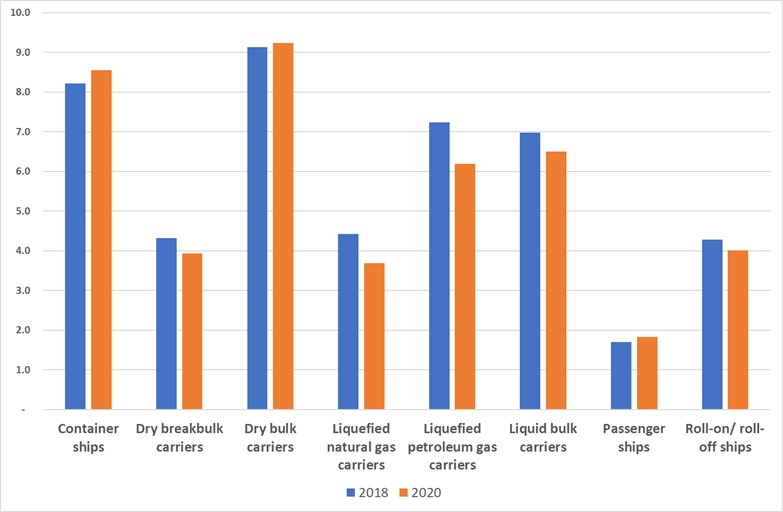
Source: UNCTAD, based on data provided by MarineTraffic.
All countries’ data is available on UNCTADstat: https://unctadstat.unctad.org/datacentre/dataviewer/US.PortCallsArrivals
More details by country and vessel type are available in the maritime country profiles: https://unctadstat.unctad.org/CountryProfile/MaritimeProfile/en-GB/710/index.html