
Labour productivity
• The value produced annually by the average worker in LDCs corresponds to just 2 per cent of the value generated by the average worker in developed countries.
• The value produced annually by the average worker in LDCs corresponds to just 19 per cent of the value generated by the average worker in other developing countries. The gap between these two groups of countries has been widening over the last 20 years, since labour productivity rose at a slower pace in LDCs than in other developing countries during that period.
• Labour productivity in Asian LDCs has risen by 3.2 per cent annually since the early 1990s, double the pace of African LDCs and Haiti.
• The LDCs that have experienced the fastest labour productivity growth since the 1990s have been exporters of manufactures (for example, Bangladesh and Cambodia) and mixed exporters (such as the Lao People’s Democratic Republic, the United Republic of Tanzania, Myanmar, and Senegal). The figure is 2.9 per cent per annum in both cases. By contrast, labour productivity declined at an annual rate of 0.8 per cent in food- and agricultural-exporting LDCs such as Malawi and Guinea-Bissau.
• Labour productivity in services has been virtually stagnant in LDCs since the early 1990s, while in other developing countries it has risen by 1.8 per cent annually.
• Industrial labour productivity continued on an upward trend despite the 2008–2009 crisis in manufactured-goods-exporting LDCs, but declined steeply in fuel-exporting LDCs such as Chad, Yemen, and Equatorial Guinea, showing the vulnerability of the latter group to international commodity cycles.
Millennium Development Goals
• Asian LDCs reduced poverty from 64 per cent to 36 per cent between 1990 and 2010, broadly in line with the Millennium Development Goal (MDG) target of halving extreme poverty by 2015. In African LDCs and Haiti, however, the variation was slight: from 65 per cent to 51 per cent.
• The prevalence of undernourishment in LDCs fell from 35 per cent in 1990–1995 to 25 per cent in 2011–2012: not enough to meet the MDG target of halving hunger.
• Net primary school enrolment in Asian LDCs increased from 60 per cent to 94 per cent between 1991–1995 and 2011–2012. In African LDCs and Haiti, it rose from 46 per cent to 71 per cent.
• The average under-five mortality rate and the average maternal mortality ratio in LDCs shrunk by nearly half between 1991–1995 and 2011–2012, from 156 to 83 per 1,000 live births, and from 792 to 429 per 100,000 live births, respectively. However, this falls well short of the MDG targets.
• In most LDCs, less than 50 per cent of people living with HIV have access to antiretroviral therapy. In only 3 LDCs is the figure above 75 per cent, falling below 15 per cent in seven other LDCs.
• Only one LDC, the Lao People’s Democratic Republic, is on track to meet all seven of the MDG targets assessed in the Report. While all 8 LDCs in South and South-East Asia are on track on a majority of targets, only 4 of 39 countries outside this region can claim as much.
• The LDCs that have advanced the most towards structural transformation are generally those that have gone furthest towards attaining the MDGs.
• Economic growth is much more effective in improving the living conditions of most vulnerable people in countries where it is accompanied by structural transformation.
Structural transformation
• Agriculture continues to account for the bulk of jobs in the LDCs: 65 per cent. This share has decreased 9 percentage points since 1991, indicating much slower structural transformation than in other developing countries, whose share has declined by 19 percentage points.
• The composition of output in LDCs has changed much more than that of employment. Industry's share of output grew by 9 percentage points between 1991 and 2012. The expansion of the industrial share of output has been driven by the rise in the extractive industries in fuel- and mineral-exporting LDCs, and by the expansion of manufacturing output in the case of manufactures exporters.
• In most African LDCs, between 70 per cent and 90 per cent of small and medium-sized enterprises lack access to formal financial institutions.
• The informal sector accounts for between 40 per cent and 82 per cent of employment in LDCs.
• In Asian LDCs, overall access to electricity ranges from 30 per cent of the population to 78 per cent. In all LDCs but Haiti and two in Africa, the range lies between 7 per cent and 32 per cent.
Economic performance
• The group of LDC economies attained an average real GDP growth rate of 5.6 per cent in 2013. This is higher than the average growth rates of developed countries (1.2 per cent) and other developing countries (4.5 per cent).
• Eleven of the 48 LDCs achieved growth rates at 7 per cent or above in 2013, while 6 registered growth rates below 2 per cent.
• Fuel-exporting LDCs registered a growth rate of 4.7 per cent in 2013, substantially lower than in 2012.
• The current account deficit of LDCs reached a record level of $40 billion in 2013, 17 per cent higher than in 2012. This was primarily due to a widening of the current account deficit of African LDCs and Haiti, which reached $35 billion in 2013.
• In 2013, the merchandise trade deficit of LDCs as a group widened by 29 per cent to reach
$21.1 billion. Only seven countries posted a merchandise trade surplus in 2013.
• The surplus in the merchandise trade of African LDCs and Haiti plummeted from $9.1 billion in 2012 to $3.9 billion in 2013, a decline of 57 per cent.
• Flows of foreign direct investment to LDCs rose by 14 per cent to a record of nearly $28 billion in 2013, the largest recipients being African LDCs. Some 45 per cent of these inflows were directed to countries specialized in the extractive industries.
• In 2013, remittance flows into LDCs rose to a record $30.7 billion, 70 per cent of which were directed to Asian LDCs.
• Despite MDG target 8D, which aims to "deal comprehensively with the debt problems of developing countries", 1 LDC is in debt distress, and 10 more are at high risk of debt distress.
• LDCs have been suffering from the erosion of the margin of trade preferences. The difference between the proportion of LDC exports1 entering developed-country markets duty-free and the corresponding figure for other developing countries has dropped from 20−25 percentage points in 1996−1998 to 2−3 percentage points since 2006. The difference between average tariffs for exports of LDCs and other developing countries in developed-country markets has fallen by half for textiles and by two thirds for clothing.
• If all members of the Development Assistance Committee had fulfilled their 2001 commitment to provide official development assistance to LDCs equivalent to 0.15–0.2 per cent of their gross national income, this would have increased their total official development assistance to LDCs in 2012 by $26.7 billion to $46.1 billion – between 66 per cent and 114 per cent of the amount they actually provided.
• The share of total official development assistance to LDCs going to the health sector increased by three quarters, from 12 per cent in 2000 to 21 per cent in 2011, while the share going to economic infrastructure and non-agricultural productive sectors fell by more than half, from 43 per cent to 20 per cent.
Full Report: http://unctad.org/en/PublicationsLibrary/ldc2014_en.pdf
Press Release
For use of information media - Not an official record
UNCTAD/PRESS/PR/2014/062 Facts and figures
The Least Developed Countries Report 2014
Geneva, Switzerland, 27 November 2014
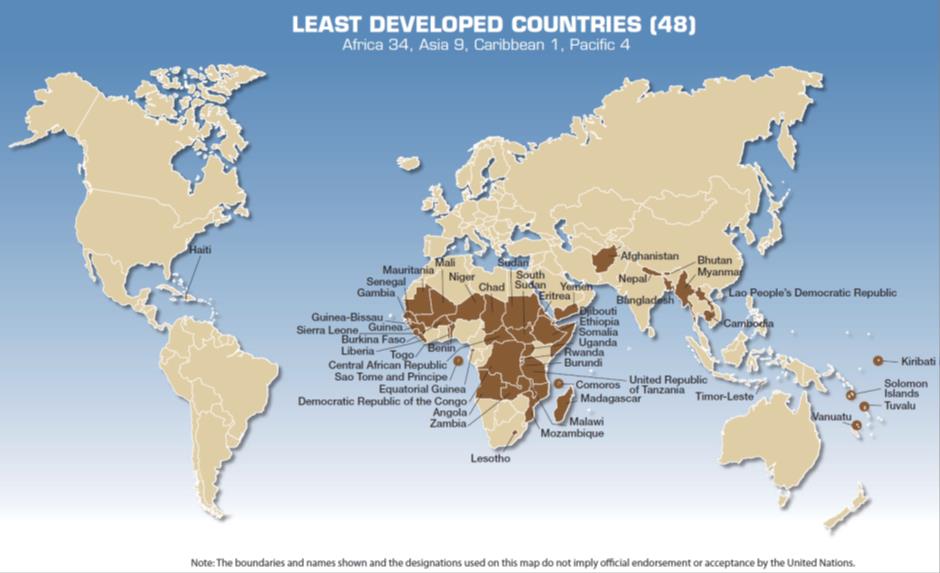
Forty-eight countries currently are designated by the United Nations as "least developed countries" (LDCs), entitling them to aid, preferential market access and special technical assistance. The following is a selection of key facts and figures about LCDs from The Least Developed Countries Report 20141 issued by UNCTAD: Labour productivity
• The value produced annually by the average worker in LDCs corresponds to just 2 per cent of the value generated by the average worker in developed countries.
• The value produced annually by the average worker in LDCs corresponds to just 19 per cent of the value generated by the average worker in other developing countries. The gap between these two groups of countries has been widening over the last 20 years, since labour productivity rose at a slower pace in LDCs than in other developing countries during that period.
• Labour productivity in Asian LDCs has risen by 3.2 per cent annually since the early 1990s, double the pace of African LDCs and Haiti.
• The LDCs that have experienced the fastest labour productivity growth since the 1990s have been exporters of manufactures (for example, Bangladesh and Cambodia) and mixed exporters (such as the Lao People’s Democratic Republic, the United Republic of Tanzania, Myanmar, and Senegal). The figure is 2.9 per cent per annum in both cases. By contrast, labour productivity declined at an annual rate of 0.8 per cent in food- and agricultural-exporting LDCs such as Malawi and Guinea-Bissau.
• Labour productivity in services has been virtually stagnant in LDCs since the early 1990s, while in other developing countries it has risen by 1.8 per cent annually.
• Industrial labour productivity continued on an upward trend despite the 2008–2009 crisis in manufactured-goods-exporting LDCs, but declined steeply in fuel-exporting LDCs such as Chad, Yemen, and Equatorial Guinea, showing the vulnerability of the latter group to international commodity cycles.
Millennium Development Goals
• Asian LDCs reduced poverty from 64 per cent to 36 per cent between 1990 and 2010, broadly in line with the Millennium Development Goal (MDG) target of halving extreme poverty by 2015. In African LDCs and Haiti, however, the variation was slight: from 65 per cent to 51 per cent.
• The prevalence of undernourishment in LDCs fell from 35 per cent in 1990–1995 to 25 per cent in 2011–2012: not enough to meet the MDG target of halving hunger.
• Net primary school enrolment in Asian LDCs increased from 60 per cent to 94 per cent between 1991–1995 and 2011–2012. In African LDCs and Haiti, it rose from 46 per cent to 71 per cent.
• The average under-five mortality rate and the average maternal mortality ratio in LDCs shrunk by nearly half between 1991–1995 and 2011–2012, from 156 to 83 per 1,000 live births, and from 792 to 429 per 100,000 live births, respectively. However, this falls well short of the MDG targets.
• In most LDCs, less than 50 per cent of people living with HIV have access to antiretroviral therapy. In only 3 LDCs is the figure above 75 per cent, falling below 15 per cent in seven other LDCs.
• Only one LDC, the Lao People’s Democratic Republic, is on track to meet all seven of the MDG targets assessed in the Report. While all 8 LDCs in South and South-East Asia are on track on a majority of targets, only 4 of 39 countries outside this region can claim as much.
• The LDCs that have advanced the most towards structural transformation are generally those that have gone furthest towards attaining the MDGs.
• Economic growth is much more effective in improving the living conditions of most vulnerable people in countries where it is accompanied by structural transformation.
Structural transformation
• Agriculture continues to account for the bulk of jobs in the LDCs: 65 per cent. This share has decreased 9 percentage points since 1991, indicating much slower structural transformation than in other developing countries, whose share has declined by 19 percentage points.
• The composition of output in LDCs has changed much more than that of employment. Industry's share of output grew by 9 percentage points between 1991 and 2012. The expansion of the industrial share of output has been driven by the rise in the extractive industries in fuel- and mineral-exporting LDCs, and by the expansion of manufacturing output in the case of manufactures exporters.
• In most African LDCs, between 70 per cent and 90 per cent of small and medium-sized enterprises lack access to formal financial institutions.
• The informal sector accounts for between 40 per cent and 82 per cent of employment in LDCs.
• In Asian LDCs, overall access to electricity ranges from 30 per cent of the population to 78 per cent. In all LDCs but Haiti and two in Africa, the range lies between 7 per cent and 32 per cent.
Economic performance
• The group of LDC economies attained an average real GDP growth rate of 5.6 per cent in 2013. This is higher than the average growth rates of developed countries (1.2 per cent) and other developing countries (4.5 per cent).
• Eleven of the 48 LDCs achieved growth rates at 7 per cent or above in 2013, while 6 registered growth rates below 2 per cent.
• Fuel-exporting LDCs registered a growth rate of 4.7 per cent in 2013, substantially lower than in 2012.
• The current account deficit of LDCs reached a record level of $40 billion in 2013, 17 per cent higher than in 2012. This was primarily due to a widening of the current account deficit of African LDCs and Haiti, which reached $35 billion in 2013.
• In 2013, the merchandise trade deficit of LDCs as a group widened by 29 per cent to reach
$21.1 billion. Only seven countries posted a merchandise trade surplus in 2013.
• The surplus in the merchandise trade of African LDCs and Haiti plummeted from $9.1 billion in 2012 to $3.9 billion in 2013, a decline of 57 per cent.
• Flows of foreign direct investment to LDCs rose by 14 per cent to a record of nearly $28 billion in 2013, the largest recipients being African LDCs. Some 45 per cent of these inflows were directed to countries specialized in the extractive industries.
• In 2013, remittance flows into LDCs rose to a record $30.7 billion, 70 per cent of which were directed to Asian LDCs.
• Despite MDG target 8D, which aims to "deal comprehensively with the debt problems of developing countries", 1 LDC is in debt distress, and 10 more are at high risk of debt distress.
• LDCs have been suffering from the erosion of the margin of trade preferences. The difference between the proportion of LDC exports1 entering developed-country markets duty-free and the corresponding figure for other developing countries has dropped from 20−25 percentage points in 1996−1998 to 2−3 percentage points since 2006. The difference between average tariffs for exports of LDCs and other developing countries in developed-country markets has fallen by half for textiles and by two thirds for clothing.
• If all members of the Development Assistance Committee had fulfilled their 2001 commitment to provide official development assistance to LDCs equivalent to 0.15–0.2 per cent of their gross national income, this would have increased their total official development assistance to LDCs in 2012 by $26.7 billion to $46.1 billion – between 66 per cent and 114 per cent of the amount they actually provided.
• The share of total official development assistance to LDCs going to the health sector increased by three quarters, from 12 per cent in 2000 to 21 per cent in 2011, while the share going to economic infrastructure and non-agricultural productive sectors fell by more than half, from 43 per cent to 20 per cent.
Full Report: http://unctad.org/en/PublicationsLibrary/ldc2014_en.pdf
Overview: http://unctad.org/en/PublicationsLibrary/ldc2014overview_en.pdf