
Global poverty is increasingly concentrated among a group of 48 countries, which are falling further behind the rest of the world in terms of economic development, according to a United Nations report released on Tuesday by UNCTAD.
The Least Developed Countries Report 2016: The Path to Graduation and Beyond – Making the Most of the Process states that a global goal to halve the size of this group will be missed unless the international community takes more action.
"These are the countries where the global battle for poverty eradication will be won or lost," said UNCTAD Secretary-General Mukhisa Kituyi, launching the Report. "A year ago, the global community pledged to 'leave no one behind', but that is exactly what is happening to the least developed countries [LDCs]."
The proportion of the global poor in the 48 LDCs has more than doubled since 1990, to well over 40 per cent. Their share of those without access to water has also doubled to 43.5 per cent in the same period. And these countries now account for the majority (53.4 per cent) of the 1.1 billion people worldwide who do not have access to electricity, an increase of two thirds.
In six LDCs, the rate of extreme poverty is between 70 per cent and 80 per cent, and in 10 more the rate is between 50 per cent and 70 per cent. There are only four other countries in the world where the rate is above 30 per cent, and nowhere else is it above 50 per cent.
This leaves many LDCs stuck in a poverty trap, a vicious circle in which poverty leads to poor nutrition and health, and lack of education, undermining productivity and investment. This in turn blocks the sustainable development needed to reduce poverty.
Countries can only break out of such vicious circles with international support in finance, trade and technology. The LDC category was created largely to target such support for those countries that most need it.
Countries graduate from the LDC category by satisfying a complex set of economic and social criteria. But only four countries have graduated in the 45 years since this classification was established.
In 2011, prompted by this glacial rate of progress, the international community set a goal that half of all LDCs should satisfy the criteria for graduation by 2020. But halfway to the target date, this goal already appears out of reach.
Only one country (Samoa) has graduated since 2011; only three more (Equatorial Guinea, Vanuatu and Angola) are scheduled to do so in the coming years. Looking ahead, the Report projects that only 13 more will qualify for graduation by 2021, far short of the 21 needed to meet the goal in 2020.
Graduation itself is only a first step towards long-term development. To weather the loss of the international support they received as LDCs and confront the challenges that lie further ahead requires what the Report calls "graduation with momentum" – a process of structural change to increase the productivity of their economies. But many of the countries projected to graduate will not achieve this.
"Graduation is not the winning post of a race to escape from the LDC category. It is the first milestone in the marathon of sustainable long-term development," said Mr. Kituyi. "So how a country graduates is just as important as when it graduates."
Likely failure to meet the graduation target, or to achieve graduation with momentum, highlights the inadequacy of international support measures to the developmental needs of LDCs. The Report therefore calls for improvements to such measures, for example:
• Fulfilment by donors of their long-standing commitments to provide 0.15–0.20 per cent of their national income for assistance to LDCs, to make aid more stable and predictable, and to align it more closely with national development strategies.
• Faster progress towards 100 per cent duty-free and quota-free access for LDCs' exports to developed country markets.
• Renewed efforts to break the stalemate on special and differential treatment for LDCs in World Trade Organization negotiations.
• Full and timely operationalization of a technology bank for LDCs in 2017, with adequate financing and due regard for each country's level of development.
• Improved monitoring of technology transfer to LDCs.
• A more systematic, smooth transition process for graduating countries, to limit the impact of losing access to international support measures when they graduate.
For LDC Governments, moving from graduation strategies to graduation-plus strategies aimed at achieving graduation with momentum is also essential. Key priorities include the following:
• Transforming rural economies by developing rural non-farm activities in parallel with upgrading agriculture.
• Combining economy-wide industrial policies directed towards market failures with policies aimed at promoting productive activities that contribute to development.
• Building capacities in science, technology and innovation.
• Strengthening tax systems, improving financial systems and addressing financial inclusion.
• Pursuing macroeconomic policies that combine stability with investment dynamism and employment generation.
• Strengthening efforts to address gender inequality across all policy areas.
-------------------------------------------------
Download: Report / Webflyer / English Overview
----------------------------------------------------
Gross domestic product per capita in the least developed countries and other developing countries as a percentage of world average, 1981–20014 (Figure 1.6)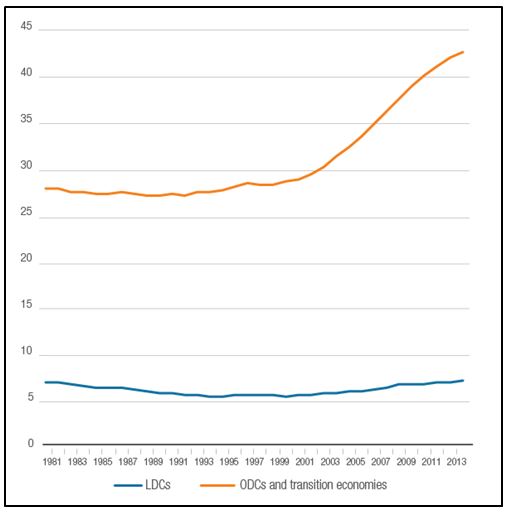
Source: UNCTAD secretariat calculations, based on data from the World Bank, World Development Indicators database.
Abbreviations: ODC, other developing country.
Share of the least developed countries in world population, poverty and infrastructure shortfalls, 1980–2014 (Figure 1.7)
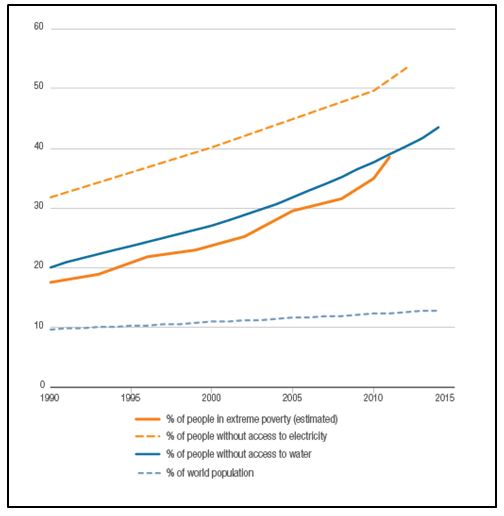
Source: UNCTAD secretariat estimates, based on data from the World Bank, World Development Indicators database and PovcalNet database.
Note: Figures for extreme poverty are approximate and are based on a poverty line of $1.25 per day at 2005 purchasing power parity (due to the unavailability of data for some LDCs at 2011 purchasing power parity at the time of writing). The estimates provided are based on the overall poverty headcount ratio for all LDCs for which data are available, multiplied by the total population for all LDCs. Since no data are available for Afghanistan, Angola (before 2002), Equatorial Guinea, Eritrea, Kiribati, Myanmar, the Solomon Islands, Somalia, Tuvalu and Vanuatu, this assumes that the average poverty headcount ratio across these countries is equal to the average across the other LDCs.
Tertiary education enrolment ratio in the least developed countries and other developing countries, 1970–2013 (Figure 1.8)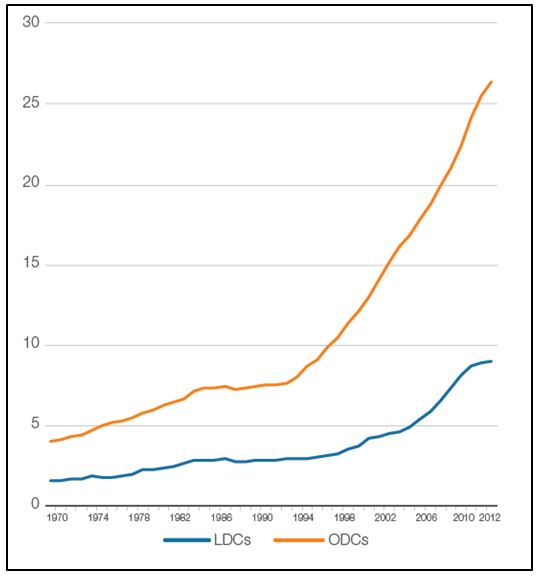
Source: UNCTAD secretariat calculations, based on data from the World Bank, World Development Indicators database.
Selected indicators of technological capabilities in the least developed countries and other developing countries (Figure 1.9)
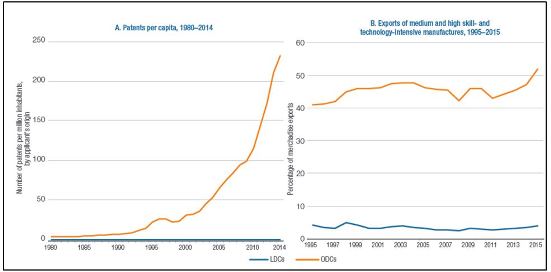
Source: UNCTAD secretariat calculations, based on data from the World Intellectual Property Organization statistics database and UNCTADstat database.
Per capita energy use in the least developed countries and other developing countries, 1971–2013
(Figure 1.10)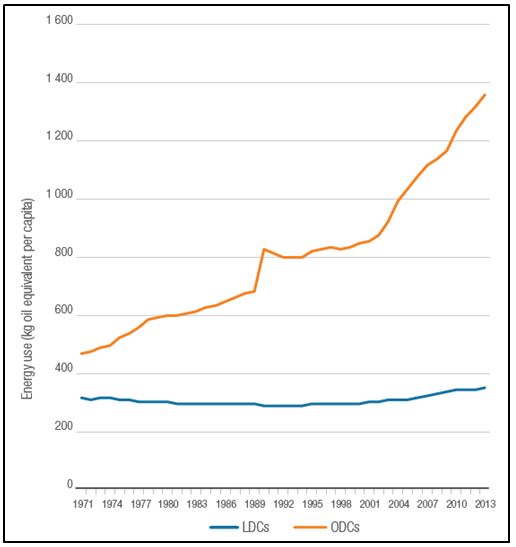
Source: UNCTAD secretariat calculations, based on data from the World Bank, World Development Indicators database.
Access to financial services in the least developed countries and other developing countries, 2011–2014
(Figure 1.11)
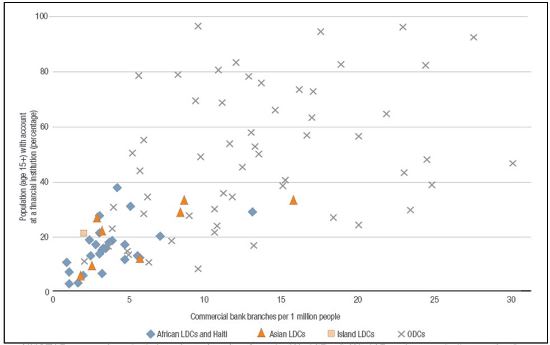
Source: UNCTAD secretariat calculations, based on data from the World Bank, World Development Indicators database.
Information communications technology access in the least developed countries, other developing countries and graduating countries, 2014 (Figure 1.12)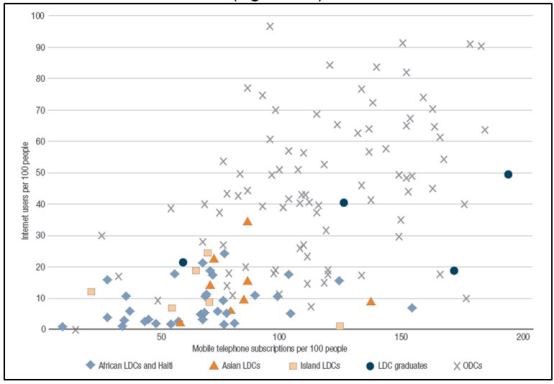
Source: UNCTAD secretariat calculations, based on data from the World Bank, World Development Indicators database
National poverty rates
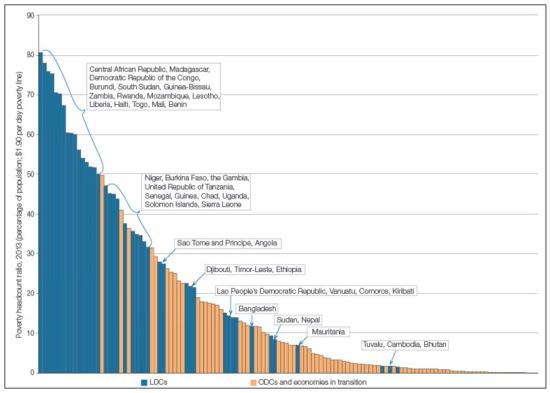
Source: World Bank PovcalNet database, available at http://iresearch.worldbank.org/PovcalNet/home.aspx.
Note: No data were available for Afghanistan, Equatorial Guinea, Eritrea, Myanmar, Somalia and Yemen. This table shows the 16 highest national poverty rates. All but three of the 29 highest national poverty rates are in the least developed countries.
Guide to the Report
Issues raised in the press release are discussed on the following sections of the Report:
- Graduation process and criteria (pp. 27–30)
- LDCs falling further behind economically (pp. 31–39)
- Increasing concentration of poverty and social deprivation in LDCs (pp. 32–33)
- Graduation with momentum (pp. 39–42/162–164)
- Past, current and projected LDC graduations (pp. 52–56)
- Existing international support measures for LDCs (pp. 83–124)
- Consequences of losing access to international support measures after graduation (pp. 129–141)
- Challenges beyond graduation (pp. 141–148)
- Recommendations at the national level in LDCs/graduation-plus strategies (pp. 164–173)
- Recommendations at the international level (pp. 173–183)
- Proposed LDC finance facilitation mechanism(pp. 177–178)